Aurora Borealis
Current OVATION 30 Minute Forecast

The OVATION Aurora Forecast Model shows the intensity and location of the aurora predicted for the time shown at the top of the map. This probability forecast is based on current solar wind conditions measured at L1, but using a fixed 30-minute delay time between L1 and Earth. A 30-minute delay corresponds to approximately 800 km/s solar wind speed as might be encountered during geomagnetic storming conditions. In reality, delay times vary from less than 30 minutes to an hour or so for average solar wind conditions.
The sunlit side of Earth is indicated by the lighter blue of the ocean and the lighter color of the continents. The day-night line, or terminator, is shown as a region that goes from light to dark. The lighter edge is where the sun is just at the horizon. The darker edge is where the sun is 12 degrees below the horizon. Note that the aurora will not be visible during daylight hours; however, the aurora can often be observed within an hour before sunrise or after sunset. The red line at about 1000 km equatorward of the brightest aurora indicates how far away viewers on the ground might see the aurora assuming good viewing conditions.
Note, a 3-day aurora forecast, based on the predicted global geomagnetic activity index, Kp, is now available as a test product: http://www.swpc.noaa.gov/products/aurora-3-day-forecast
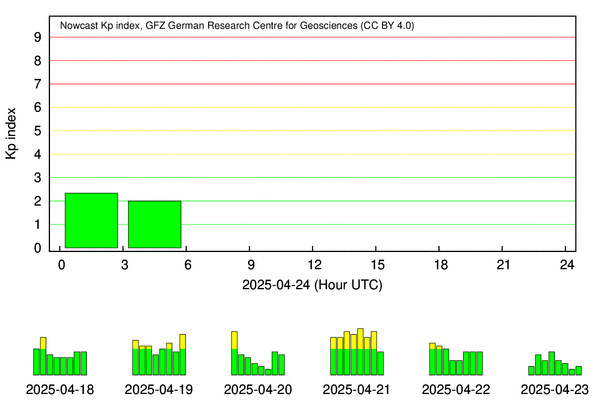
Latest KP Index
 source |  source |

Resources
- NOAA Space Weather Prediction Center
- SWPC Space Weather Enthusiasts Dashboard
- SWPC Tips on Viewing the Aurora
- SWPC Topic Paper Aurora

|  IN-AL-99 |


